
Numbers for the people who lead it. A queue for the people who run it.
One screen for the leadership team. Then the exceptions on it become work that runs itself, with a person at each gate.
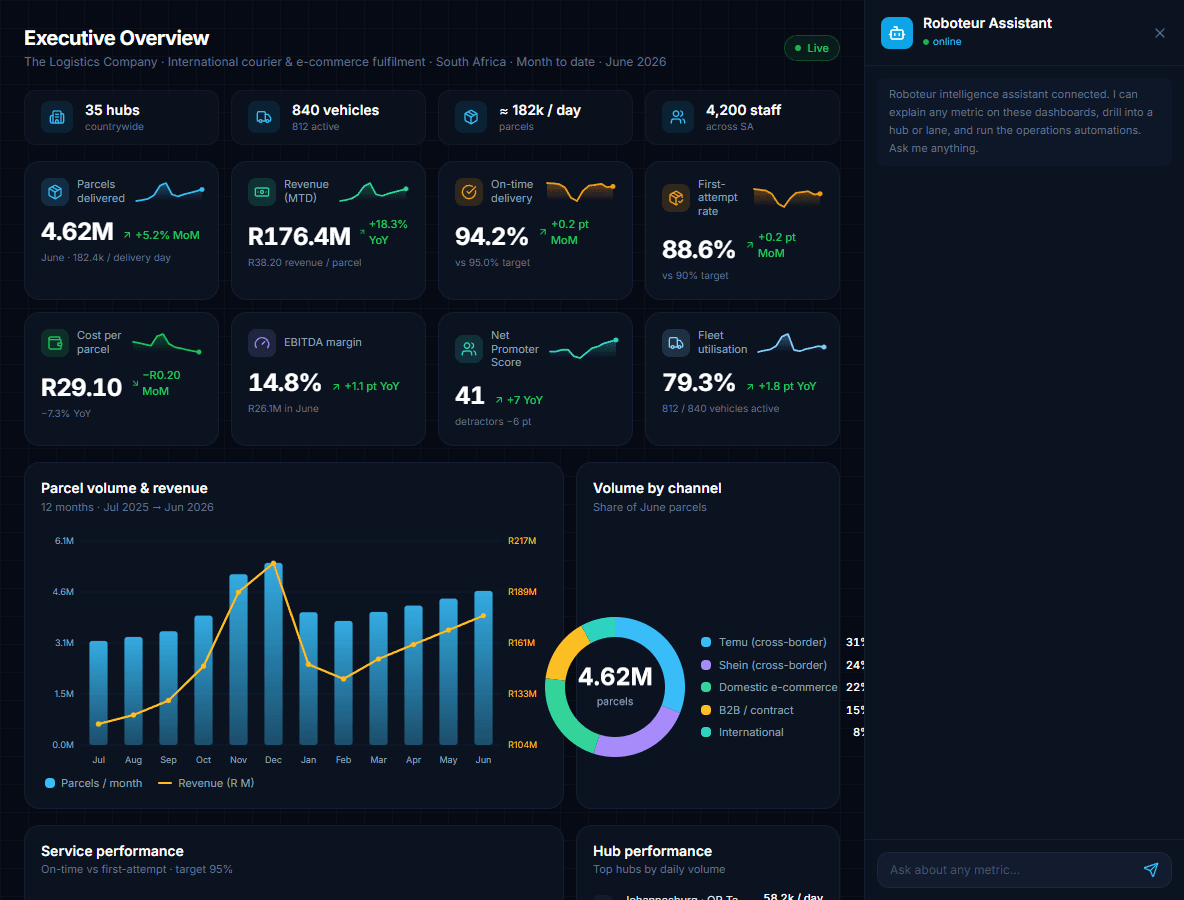
What goes in, what comes out.
The operation's own data: parcel tracking, the warehouse, fleet telematics, carrier invoices and returns.
Dashboards for the chief executive, operations and finance, and three automations: failed-delivery recovery, carrier invoice reconciliation and returns.
- 01
Open on the executive view
The numbers the leadership team reads.
- 02
Drill into operations and finance
From the total to the depot to the parcel.
- 03
Open an exception
A failed delivery, an overbilled invoice, a damaged return.
- 04
Let the automation work it
Across every system that holds a piece of it.
- 05
Approve at the gate
One decision per automation, for a person.
Where a person decides.
Each automation has one gate: a high-value or repeatedly failed parcel, a carrier invoice that does not match, a damaged return to claim or write off. A person decides each.
- Parcel tracking
- Warehouse management
- Fleet telematics
- Accounting
- Messaging
- Customs and tax
Mocked in the demonstration. In a delivery, they are yours.
The numbers on this screen are invented. What we have measured in production is on Proof.
If your process needs people to run, it's broken.
Pick one process. We design it in a week and prove it in 14 days.